37%
of host bios say founder, co-founder or owner.
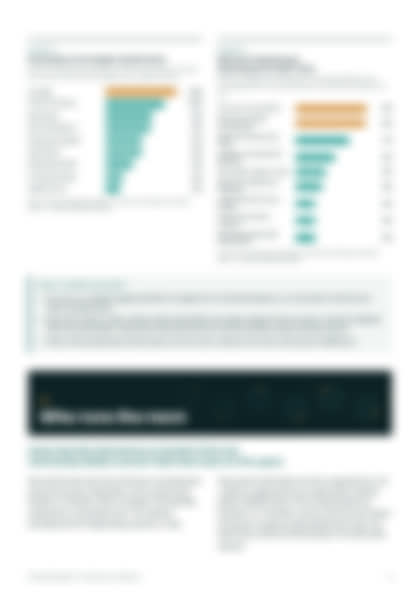
Professional events are a founder's channel. At host organisations, the leader we could match is a founder or co-founder 46% of the time.
OneHop Research · Industry Insights · November 2026
Benchmarks for people who host professional events: who your peers are, how often they run, what they charge, when they schedule and how big their rooms get.
 17 pages · 29 exhibits
Executive summary
We read public listings on four ticketing and community platforms, kept the 71,520 events that are about work, and profiled the 20,940 people and organisations who run them.
37%
Professional events are a founder's channel. At host organisations, the leader we could match is a founder or co-founder 46% of the time.
74%
Those groups have a median of 71 members. Groups with five or more organisers have 1,093.
20x
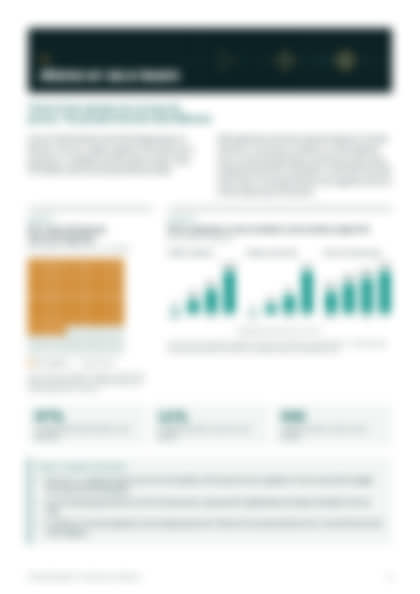
Median membership climbs from 48 at one to four events to 946 past one hundred. Consistency compounds.
67%
The top 1% alone account for 27%. A small group of serial hosts carries the category.
36%
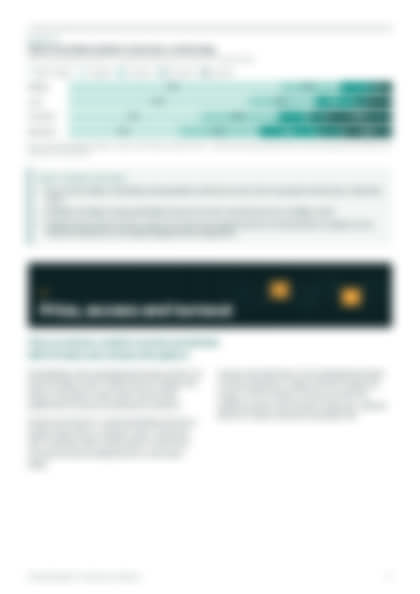
Thursday alone takes 25% of the week. Breakfast and Saturday mornings are far less crowded.
US$34
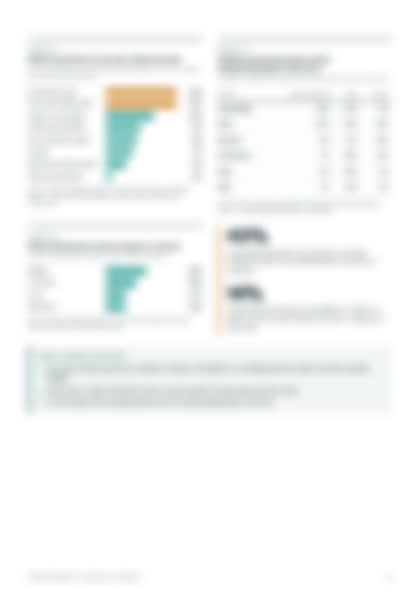
43% of professional events there are free. Networking sits near US$13; classes and conferences clear US$135 or more.
22
Only 13% pass one hundred. Small rooms are the norm, and 47% of listings ask guests to apply.
12%
It is the largest named theme, ahead of finance, real estate and careers.
38%
Only 52% point to a website. For most hosts, the listing platform is the whole front door.
In the full report
How many professional events there are, and who lists them.
The roles hosts give themselves, and who leads host organisations.
What a group looks like with one organiser, two, or five.
How audiences differ between hosts on their fifth event and their hundredth.
Formats and themes, ranked.
The week, hour by hour: the crowded slots and the quiet ones.
What hosts charge by format, who asks guests to apply, and how many sign up.
Cities, countries and how much has stayed online.
Websites, LinkedIn pages and the hosts with neither.
Seven moves, and a scorecard to benchmark yourself against the top quarter and the top tenth.
Public event listings read in early November 2026 on four ticketing and community platforms. Figures are medians and shares across hosts; sign-ups are not attendance. No attendee or member lists were read, and no person or organisation is named in the report.
Eventbrite, Meetup, Luma and Humanitix are trademarks of their owners. OneHop is not affiliated with, endorsed by or sponsored by any of them.